By Paweł Kaczyński, who built and sold three food brands; one reached $203,956 in a month · Updated July 2, 2026
Price meal prep from your costs upward, never from a competitor’s menu downward: the dish price should be roughly four times the ingredient cost, so that packing, delivery, refunds and advertising still leave a real contribution. In a prepaid model you price the week, not the meal, and the bundle hides less than you fear.
Pricing is where new operators hurt themselves twice: once by copying a competitor whose costs they cannot see, and again by being afraid to correct the mistake. I priced three brands through launches, corrections and a sale of each business. Here is the method that survived all of it.
How should you price a meal prep meal?
Work upward from the ingredient cost of each recipe, not downward from what the shop across town charges. Cost the dish from current invoices, then set the price so ingredients sit near a quarter of it; that multiple is what leaves room for packing, the courier share, refunds, advertising, and a contribution that actually reaches your account. The competitor’s menu tells you nothing useful, because you cannot see their drop density, their courier contract, or whether they are quietly losing money to look busy. Two guardrails from my own kitchens. Never let a single dish ship below its variable cost, whatever the average says; per-recipe costing catches this, menu-level averaging hides it. And check the ratio weekly against a target, because food cost drifts upward one innocent swap at a time.
Why do you price the week, not the meal, in prepaid?
Because the customer in a prepaid model buys a plan, and the plan is where your economics are decided. A subscriber choosing five days of two meals is committing to ten bags; that commitment lets you buy exactly, cook exactly, and route couriers efficiently, all of which drops your true cost per bag. Reward it visibly: the per-meal price inside a bigger weekly plan should be gently lower than inside a small one, and the discount you give must be smaller than the cost you save, or you are buying volume with your own margin. The deeper prize is the balance itself. Money loaded before cooking means growth funds itself, which is the cash-flow flip that makes this model attractive at all. Price the plan so the customer feels the reward for committing, and you get the drop density that lowers your cost per bag.
What belongs in the price besides food?
Everything the bag touches on the way to a door. Packing: trays, sacks, labels, the part-hour of the person filling them. Delivery: the courier share per bag, which depends brutally on how many bags land at one address, so a lone bag in a distant suburb may cost more to serve than its food did. Refunds and skips: portions paid for then dropped still consumed planning and sometimes production. Acquisition: the ads and referral credits that won the customer, spread across the orders they actually stay for. New operators price for the food and treat the rest as noise; then the noise eats the year. My habit was to write the full per-bag cost stack next to every plan price once a week, the same review that watched food cost. When a plan stopped clearing its stack, the plan changed, not the hope. How many customers your price needs to break even is its own arithmetic.
When and how do you raise prices?
Sooner and smaller than instinct says. Costs move continuously; operators move prices in rare, oversized, apologetic jumps, which is the worst of both worlds. The subscription structure gives you gentler tools. Correct new-customer pricing first while protecting existing balances, so loyalty is visibly rewarded. Introduce the higher price with the next menu season instead of a bare announcement. Use plan design: a new, better-composed weekly plan can carry the corrected price while the old plan retires quietly. What you must never do is defend an outdated price by cheapening ingredients; in a product someone eats daily, the tongue audits you faster than any spreadsheet, and churn costs more than the correction would have. If a rise still scares you, test what your current price is really contributing first; the calculator usually shows the fear is more expensive than the fix.
Take the benchmark sheet with you
Get the food-cost benchmark sheet, free.
The ratios I held weekly across three brands, the same ones this pricing method protects: ingredients, packing, courier share, contribution per bag. Straight to your inbox.
Pay-per-order means you buy ingredients today and hope for orders tomorrow; prepaid means the customer funds the week before you shop. Same menu, opposite cash flow — and cash flow is what closes most food businesses in year one.
Price the week, not the plate. A weekly prepaid price anchors the customer to a subscription instead of inviting a per-meal comparison with restaurant menus.
By Paweł Kaczyński, who built and sold three food brands; one reached $203,956 in a month · Updated July 2, 2026
There is no universal customer count for breaking even in meal prep; the honest formula is new fixed costs divided by contribution per bag, then by bags per customer per week. For an operator adding a prepaid line to a kitchen already paid for, the answer is often startlingly small, because each bag only has to clear its own variable costs.
Somewhere on a forum tonight, a stranger will answer this question with a confident round number. Ignore them. I ran three meal prep brands from one kitchen, and I can tell you the count differs wildly between two owners on the same street. What never differs is the arithmetic. Here it is, short enough to do on a napkin.
What is the break-even formula for meal prep?
Divide the fixed costs your meal prep line adds by the contribution each bag makes, and you have your break-even in bags; divide again by bags per customer per week for the customer count. Contribution per bag means the dish price minus ingredients, packing, and the delivery share for that bag. Fixed costs mean only what the line genuinely adds: extra staff hours, new equipment, the software, the ads you commit to monthly. Notice what does not belong in the fixed column for an existing venue: rent, licences, and the core crew, because your current trade already pays them. That single accounting choice is why the same line breaks even at a handful of customers inside a working kitchen and at hundreds for a start-up signing a fresh lease. Put your own numbers through the operator profit calculator and the division is done for you.
Why do existing kitchens break even so much sooner?
Because a start-up must climb over the whole cost mountain before its first profitable bag, while an existing kitchen has already climbed it. A new founder needs the subscriber book to carry rent, fit-out, licences, insurance, and a crew, all before profit begins. An operator bolting a prepaid line onto a venue the lunch service already funds needs each bag to clear only its own ingredients, packing and courier share. In practice that means the bolt-on case often breaks even within its first stable weeks, at a customer count you could assemble from regulars and referrals alone, no advertising involved. This asymmetry is the entire strategic argument for adding a meal prep line to a kitchen you already run instead of building a meal prep company from zero. The model rewards whoever already owns the fixed costs.
Which numbers move your break-even most?
Three, in order of leverage. First, contribution per bag: a small rise in dish price, or a drop in food cost toward the quarter-of-price target, cuts the required count directly. Second, drop density: two bags landing at one address split a courier fee that one bag would carry alone, so households and offices are worth more than their order value suggests. Third, bags per customer: a subscriber eating five days a week advances you toward break-even five times faster than a twice-a-week dabbler, which is why plan design quietly matters more than marketing volume. And one number moves it in the wrong direction: churn. A customer who leaves before repaying their acquisition cost raises everyone else’s burden. Winning durable customers, not just customers, is the real assignment, and that playbook is here.
A worked example you can copy
Say your plan sells at a dish price where each bag contributes a few dollars, about the price of a coffee and a sandwich, after ingredients, packing and its courier share. Say the line adds one part-time packer and a modest ad commitment as genuinely new fixed cost each month. Divide the monthly fixed addition by the per-bag contribution and you get bags per month; divide by roughly twenty eating days and a one-bag-a-day subscriber, and you land on your customer count. Run it with your real prices and the pattern repeats: for a working kitchen the answer is usually tens, not hundreds. Then stress it: halve your drop density, add a slow month, let food cost drift a few points. If the count still looks reachable from your own regulars, the line deserves a pilot week. If not, fix contribution first, count later. The maths behind every row lives in is a meal prep business profitable.
Take the benchmark sheet with you
Get the food-cost benchmark sheet, free.
The ratios that decide contribution per bag, from three real brands: ingredients, packing, courier share. One page beside your own numbers. Straight to your inbox.
By Paweł Kaczyński, who built and sold three food brands; one reached $203,956 in a month · Updated July 2, 2026
A meal prep business can reach six figures in monthly revenue from a single kitchen; my brand Cebulka hit $203,956 in its best month. But revenue is the wrong number to envy. What you keep after ingredients, labour, packaging, couriers, refunds and advertising is the real answer, and it is decided by discipline, not by scale.
Every “how much can you make” article I have read quotes somebody else’s survey. This one speaks from inside my own brands. I built three of them, ran them from one kitchen at a peak of roughly two thousand bags a day, and sold all three. Here is what the money actually looked like from the inside.
How much revenue can a meal prep business generate?
From one licensed kitchen, a well-run prepaid meal prep operation can reach six figures in a month; Cebulka’s best month was $203,956. That number is real, and it is also the most misleading number on this page if you stop reading here. That number took years, three brands, and a kitchen at full rhythm to reach. The honest earnings curve looks different at each stage. A fresh line inside an existing kitchen typically starts with dozens of subscribers from the owner’s own circle, which reads as a modest add-on, not a headline. The compounding starts when the weekly book stabilises: prepaid customers reorder, referrals stack, and the same fixed kitchen carries a rising order count. Scale is a consequence of retention discipline, never a starting condition.
What does the owner actually keep?
Whatever survives the subtraction stack: ingredients, labour, packaging, couriers, refunds and skips, then advertising. On a disciplined prepaid line, ingredients sit near a quarter of revenue, and I keep a whole benchmark page on that ratio. The rows that surprise new operators are couriers and churn. A delivery costs the same whether the bag feeds a light eater or a heavy one, so low drop density can quietly eat what the kitchen earned. And a subscriber who leaves in week three never repays what they cost to win. The full row-by-row ledger, with who controls each line, lives in is a meal prep business profitable. My rule from those years: judge the business by contribution, the money that survives everything, because a fat revenue month with leaky rows can still shrink the bank account.
Why do earnings differ so much between operators?
Because two structural facts dominate everything else: whether the kitchen is already paid for, and whether customers pay before you cook. An operator bolting a prepaid line onto a venue that existing trade already funds only needs each bag to clear its own variable costs; a standalone start-up must climb over rent, crew and licences before the first cent of profit appears. That is why the same subscriber count makes money for one owner and loses money for another. The prepaid part matters just as much: cash arrives before ingredients are bought, so growth funds itself instead of drawing down savings. When you hear wildly different “how much I make” stories in this category, ask those two questions first, and the spread usually explains itself. The walk-through for the bolt-on case is how to add a meal prep line to your kitchen.
What would those numbers look like in your kitchen?
You can estimate it in five minutes instead of wondering. Take your realistic plan price, your current food-cost share, your local courier rate, and a modest subscriber count you could reach from your own regulars. Put them through the operator profit calculator; it returns the weekly contribution your version of this business would produce, using your figures rather than my story. Two honest warnings from my own books. Do not model your launch on my best month; model it on a boring week, because boring weeks are what a subscription business is made of. And whatever the calculator says, the number that decides your first year is not on it: it is how many happy eaters ask you “can my friend join too”, which is why winning the first customers is the real gate.
Take the benchmark sheet from my kitchens
Get the food-cost benchmark sheet, free.
The target ratios I held weekly across three brands: ingredients, packing, courier share, contribution per bag. One page to lay beside your own numbers. Straight to your inbox.
$203,956 in one month from one kitchen is what the prepaid model can produce at full throughput — reached in month four. The ceiling is set by kitchen capacity and delivery radius, not by the menu.
By Paweł Kaczyński, who built and sold three food brands; one reached $203,956 in a month · Updated July 2, 2026
A good food cost for a prepaid meal prep line sits near a quarter of the dish price. I held my own brands just under that mark, and I checked it weekly, never quarterly. Restaurants often run higher; meal prep can run tighter because you cook to paid orders, with no plate waste from guessing demand.
You typed a version of one question: my ingredients eat this share of my price, is that good? Here is the operator’s answer, from someone who watched that ratio every week across three brands, not from a textbook.
What food cost percentage should you aim for?
Aim near a quarter of the portion price for a prepaid meal prep line. I ran my own kitchens just under that mark, and the target was printed into every weekly review. Notice what the number is not: it is not the third-or-more that a full-service restaurant often tolerates. Meal prep earns the tighter ratio structurally, because you cook against a list of meals already paid for, so nothing is cooked on a guess and thrown away at closing. If your ratio sits meaningfully above a quarter, one of three things is usually true: your dish price is set too low for your market, a few recipes are quietly too rich for their price point, or purchasing has drifted while nobody compared invoices. Each has a different fix, and the ledger view of all three lives in is a meal prep business profitable.
Why is the percentage alone a trap?
Because a beautiful ratio on a spreadsheet says nothing about when you measured it. Food cost fails operators through timing, not arithmetic. The ratio drifts one innocent decision at a time: a richer cut of protein, a garnish someone loved, a supplier price rise nobody re-negotiated. None of those feels like a mistake on the day. By the end of a quarter they compound into a margin hole no report can undo. The operators who defend their margin are rarely better mathematicians; they simply compare spent-versus-target every single week, per production run, while the drift is still one decision old. My rule from the packing floor: a food-cost check you run weekly at a rough quarter target beats a perfect percentage you audit twice a year, every time.
How do you actually count food cost in meal prep?
Count the ingredient cost of one finished, portioned meal, divide by the price the customer pays for that meal, and do it per recipe, not per menu. The per-recipe part is where most owners slip. A menu-level average hides the two or three dishes that are quietly underwater; the salmon that costs a third of its price stays invisible next to the lentil dish that costs a sixth. Cost each recipe from real purchase invoices, current ones, not the prices you remember. Then weight by how often each dish actually ships in your rotation. In a prepaid model you know exactly how many of each meal you will cook this week, because they are already ordered, which makes this arithmetic honest in a way a walk-in restaurant can never match. That certainty is one of the model’s real gifts; use it.
What moves the ratio without touching quality?
Four levers, in the order I would pull them. First, portion engineering: hold the protein where the customer notices it and trim where they do not; a starch costs a fraction of a protein. Second, rotation design: compose the weekly cycle so rich dishes are balanced by lean ones on purpose, instead of letting the menu drift toward whatever the chef enjoys cooking. Third, purchasing rhythm: re-quote your top ingredients on a schedule, because suppliers raise quietly and reward the customer who asks. Fourth, price: operators treat the dish price as sacred long after their costs have moved, and a small correction across a whole prepaid book lands directly on margin. What I would not do is chase the ratio into ingredient quality the eater can taste. In a subscription, the customer eats you every day; they notice cheapening faster than any spreadsheet does.
Take the benchmark sheet I used
Get the food-cost benchmark sheet, free.
The target ratios I watched weekly across my brands: ingredients, packing, courier share, contribution per bag. One page to lay beside your own numbers every week. Straight to your inbox.
By Paweł Kaczyński, who built and sold three food brands; one reached $203,956 in a month · Updated July 2, 2026
Yes, a meal prep business is profitable when three numbers hold at once: ingredient spending near a quarter of the dish price, delivery fees split across bags landing together, and subscribers who stay past week three. Run from a kitchen you already pay for, the venture typically clears break-even sooner than a standalone start-up.
Most “is meal prep worth it” pages are written by people who never packed a single bag. I have. I built three food brands and sold all three. One of them, Cebulka, reached $203,956 in its best month. So this guide answers the money question the way an owner actually lives it. Not as a dream, but as a margin ledger you can run against your own venue. If you already hold a licensed kitchen, a restaurant, a catering firm, or a ghost operation, you sit closer to profit than you think. The hard part is rarely the cooking. It is the arithmetic underneath it.
Is a meal prep business profitable?
Yes, this can be a genuinely lucrative trade, but the gain lives in a narrow band, and most new ventures lose it before they ever see it. Here is the honest version. The food itself seldom sinks you. Your real enemies are couriers, last-minute cancellations, and subscribers who bail after three weeks. A prepaid programme wins when three conditions hold at once. You need a steady weekly order book, so the venue runs full. You need a tight grip on what each dish truly costs to make. And you need courier fees you do not quietly absorb yourself. Hold those three and the prepaid model bankrolls you in advance, which is an enviable position for any restaurant. Miss them and a handsome revenue figure curdles into red ink. The rest of this guide walks that ledger row by row.
The meal prep margin, line by line
Profit here is never one figure. It is a cascade of small subtractions. Below sits the skeleton every owner should be able to complete for their own premises. The values stay as plain ratios, so you can substitute yours.
Line item
What it means
Who controls it
Dish price
What the buyer pays per portion
You, against local willingness to pay
Ingredients
The raw food inside each portion
Recipe design and purchasing
Labour
Cooking, packing, sorting, staff hours
Your crew and how full the shift runs
Packaging
Trays, sacks, printed labels
Your supplier
Courier
Carrying bags to the door
Often the silent assassin
Refunds and skips
Portions paid for, then dropped
Your subscription rules
Acquisition
Cost to win one fresh buyer
Your funnel
Contribution profit
Whatever survives all of the above
The only score that counts
Read the final row twice. Plenty of brands post a fat top line and still fold, because they only ever watched turnover. The question is never how much you sold. It is whether the bank balance grew once ingredients, labour, packaging, couriers, refunds, and advertising were all paid. At the peak of my own brands we packed roughly two thousand bags a day, and I can tell you from that floor: the days the balance grew were never the days the revenue chart looked prettiest.
What food cost should a meal prep operator target?
Aim for ingredient spending near a quarter of the portion price, and treat the discipline holding it there as weightier than the exact figure. Food cost drifts upward one innocent menu swap at a time. A richer protein here, a garnish there, and by month end the ratio has crept up without one decision that felt wrong. The fix is a weekly habit, not a report read at quarter close. Compare what you genuinely spent against the target, every production cycle, while you can still act. When spending climbs above the goal, you catch it that same afternoon, not after the damage is booked. That habit alone separates a venue defending its margin from one bleeding away slowly. Timing beats precision here, always. For the deeper arithmetic, I keep a separate breakdown of what a good food cost percentage looks like for a meal prep operation.
Why do couriers, not chefs, decide your profit?
Because a delivery costs roughly the same whether the bag holds one portion or three. When an owner’s sums refuse to work, the trouble usually waits at the door, not the stove. A single-portion subscriber in a remote district can cost more to serve than they bring in. You would never spot it on the kitchen floor. The remedy is structural, not heroic. Price each order by zone, and by how many bags reach one address. Add a small surcharge for a lone bag in a distant area. Then divide the delivery fee across the bags that land together on the same street. That division is quiet but decisive. It reveals the true margin on each run, so you stop guessing which neighbourhoods earn their keep and which ones drain you. Most venues never run this sum, and it is precisely where profit escapes unseen.
How do prepaid subscriptions change the cash picture?
They flip your cash cycle, which is the quiet reason the category attracts owners at all. In an ordinary restaurant you cook first, then hope someone walks in. In prepaid meal prep, the buyer loads a balance before you touch a pan. So the money arrives ahead of the work, and production answers orders already settled. Instead of financing groceries and waiting weeks to recover, you operate on funds already resting in the account. This does not decide whether each portion earns its keep. The margin table still rules every bag. Instead, a healthy operation bankrolls its own growth rather than borrowing to expand. For anyone already carrying the fixed weight of a licensed venue, that prepaid float is among the strongest reasons to bolt this offering on. The cash shows up first, and the kitchen you already pay for finally fills its quiet hours.
Where does profit leak after someone subscribes?
The biggest leak after couriers is people quitting. Winning a subscriber takes real money in ads and effort. If they leave after a few weeks, you never recover that outlay, and the whole tally tips negative however good the cooking was. So retention is not a soft courtesy. It is a hard profit row, and most owners ignore it. Two habits guard it. First, keep the menu from repeating inside a week, so palates do not bore and wander off. Second, chase the people who lapse, sort them by how recently they left, and hand them a real reason to return. An owner who watches only fresh signups, and never the back door, is filling a bucket riddled with holes. The buyer you already paid to win is the cheapest repeat sale available, and the easiest to lose through plain neglect. Landing them in the first place is its own craft, and I wrote a separate guide on how to get your first meal prep customers.
How many subscribers do you need to break even?
There is no single magic count, and anyone who quotes you one is guessing. Your break-even depends on a load you already carry. That is the fixed expense of the kitchen you are paying for anyway. If the rent, the core crew, and the licences are already covered by your existing trade, each prepaid bag only has to clear its own variable outgoings to add profit. Ingredients, packing, and delivery, nothing more. That is the incremental advantage, and it is why an existing kitchen reaches break-even far sooner than a start-up cooking from scratch. Work it from the bottom up, not the top down. Find your contribution per bag, meaning what survives after the variable expense of that one bag. Then divide whatever fresh overhead the venture genuinely adds by that amount. The answer is your real break-even count. For an operator simply filling idle hours, it is usually smaller than the fear in your head.
So, is meal prep worth it for an operator like you?
For someone starting bare, this is a steep climb. For an owner already running a licensed venue, the verdict shifts hard in your favour. You carry the fixed load already: crew, gear, permits. Bolting a prepaid offering onto that base spreads overhead across more income, and the float lifts your cash position from the first week. The reward is earned in the margin table, not the glossy photos, and it rests on three disciplines held together. Pin ingredients near a quarter of the dish price. Price each delivery so a drop never eats its own margin. Keep buyers long enough to repay winning them. Hold all three and this ranks among the better margin opportunities in food today. Lose any one and the handsome top line turns back into a loss. The practical walk-through of the bolt-on itself lives here: how to add a meal-prep line to a kitchen you already own.
Take my benchmark sheet with you
Grab the food-cost benchmark sheet I measured my brands against.
The precise target ratios I watched weekly: ingredients, packing, courier share, contribution per bag. A single reference you can lay beside your own ledger every week. Free, delivered straight to your inbox.
Pressure-test your own kitchen before you commit a shift
You do not need a spreadsheet degree to judge whether your idea clears. You need one honest lap through the ledger above, with your own local prices. So I distilled the operator benchmarks from my brands into a free calculator. Food cost, courier share, churn, contribution per bag. Type in your figures, and roughly five minutes later it reveals whether the concept pays before you cook a single tray. Run the operator profit calculator.
When you are ready to turn the maths into a live operation, the founder’s starter kit walks you through landing your first paying customers, the part that actually decides whether the venture survives. See how it starts. I also built the software side of running a prepaid service, but read the guides first; the maths comes before any tool. For more operator guides, browse the operator playbook.
$203,956 in one month from one kitchen is what the prepaid model can produce at full throughput — reached in month four. The ceiling is set by kitchen capacity and delivery radius, not by the menu.
“Paweł, we need to hire more people immediately. There is so much work that we will probably have to introduce a night shift. With the rapid growth of the business, we need to think about moving – this 600m2 site is becoming too small for us,” I was really worried. At the time we had 25 kitchen staff, 600 parcels a day and one catering brand.
I was happy that the number of customers was increasing, but I had the impression that costs were rising disproportionately faster. There were more of these things – at least once a day I heard the boss say to the production assistant: “go to the store, we’ve run out for production”. How could this be, when we had exact recipes and shopping lists? In a moment it turned out that the day after we bought things for the social, 6 packs of coffee disappeared – that’s how much even the most seasoned coffee drinker wouldn’t drink.
One thing was for sure – money was leaking through our fingers. At least it was not a thin stream. I felt like I was fighting a hydra – for every problem, two more seemed to pop up. They seemed to pile up and the more I tried to find out where we were going wrong, the more problems appeared. I tried talking to the staff. I got a number of suggestions, such as that the theft and low efficiency were due to wages being too low, because “employees just have to compensate themselves”. I tried talking to catering experts: “Look Paul, this is a specific industry. This is how it is. You can’t control everything”, “You’ve got to get good people”, “You can’t do anything about it, you’ve got to do everything yourself if you want it to be good”.
I finally understood. The real problem was the lack of a map, a structure that would make me aware of which fires I needed to put out immediately because they threatened to collapse the entire structure, and which fires, while undesirable, would not kill me immediately and I could return to them in a moment.
Sorting meal boxes in my meal-prep kitchen.
It became my ambition to pass the McKinsey problem-solving test. In the materials I used to prepare, there was a lot of reference to the MECE method. The name comes from the English words Mutually Exclusive, Collectively Exhaustive. For example, a population can be divided into men and women – each person can belong to only one of the two, and at the same time there are no people who do not belong to one of the two. An example where this principle is not fulfilled is nationality – people can change their nationality, they can be citizens of many countries. In such a division, the sum of the sets will be greater than the number of people.
The purpose of this method is twofold:
Make sure we don’t miss anything
To spend the minimum amount of time necessary to solve the problem by not having to go back or repeat – everything is sorted.
I began to group my problems into category trees, common themes. As I wrote down and organised the problems and my thoughts about them, things began to fall into a logical whole. I began to see connections and understand where the problem lay.
My views on the need for change were not met with approval. For example, my disagreement with a 50% pay rise was not met with approval. I felt trapped. I wanted the business to be healthy. Conflict with employees and the risk of production stoppages – the very thought of that paralysed me.
I wouldn’t be surprised if you’ve encountered similar situations. Looking back, I think a lot of things are done provisionally, for “holy peace of mind”, like a payday loan. It solves the problem in the short term, but then it turns out that the cost is gigantic. Then another loan, and the spiral of debt is so great that it’s hard to get out. No one has ever shown me the problems I can face, and I suspect that you will not either. Ignorance and old habits are our common enemy. That’s why I’m going to show you 14 places where I’ve missed out on money, to help you out.
I have created many different categories. So don’t get too attached to mine. The key is to group the subject and have fairly consistent groups. Items on individual lists can come and go, but the list of topics is relatively constant.
Purchasing and Suppliers
Warehousing and Inventory
Production and Preparation
Management and Administration
Now I will show you the 4 stages of problem diagnosis:
“Triage – what are the most urgent problems? When paramedics arrive at the scene of an accident, they don’t treat casualties on the spot. They make a quick assessment of the injuries and decide who needs help first. It’s the same with running a business – I think about which category I need to focus on first because it threatens the running of the business.
My daughter says, “Trousers down, cards on the table” and I think it fits this point perfectly. Once I have identified a category, I try to uncover all its problems. I knew about problem A, but I wonder what is B, C, D. What if you cure gangrene when the flu kills you?
“We play in pairs. – There’s a reason they say problems come in pairs, or even in herds. Once I’ve identified them in point 2, I group similar ones that have a single cause.
“You did not stand here”. – At this stage I know which area needs attention first, I have identified all the potential sources of problems that I could, grouped the issues and understood the interrelationships. This is how I arrived at the final list of problems, which I arrange in order. It’s important not to jump from issue to issue. Think of it as a street fight. Even if you are an experienced karateka, boxer or other fighter, and no average thug has a chance against you – the force of evil against one. What will you do in such a situation? You will shout: “One at a time! Then the problems will not overwhelm you and you will have the strength to deal with each of them.
Below are examples of problems you may encounter in each of the categories listed. The list is not exhaustive and there will be issues in your business that I have not included below.
Purchasing and Suppliers
1. Lack of regular price monitoring
In the foodservice industry, ingredient prices can change faster than the weather in the mountains. Lack of regular price monitoring is like driving a car without a seatbelt – sooner or later something will happen. By implementing a systematic review of supplier prices, you can react to changes in real time and avoid unnecessary costs. At Flambia Market we have learned that regular price analysis can save up to 10% per month.
2. Ignorance of the supplier market
Not knowing the supplier market is like going fishing without a rod. You need to know all the players in the market to get the best deals. By regularly comparing offers, you can get better terms and avoid overpaying. I remember one time we found a new vegetable supplier who offered better prices without compromising on quality. As a result, we were able to reduce costs and increase margins.
3. Don’t compare supplier offers
Comparing suppliers’ offers is an important part of your purchasing strategy. It is like the stock market – you need to know where and when to invest. More than once we have found that different suppliers offer the same products at different prices. By comparing quotes, we found a supplier who sold coffee 20% cheaper. This decision allowed us to save a significant amount of money without compromising on quality.
4. Buying branded products instead of cheaper substitutes
Buying branded products is simply paying for a logo. Instead, it makes sense to look for cheaper but equally good substitutes. In my practice, switching to non-branded products in some categories has allowed me to cut costs without compromising on quality.
Warehousing and Inventory
5. Poor inventory management
Poor inventory management is like trying to keep water in a strainer – nothing will come of it. Regular inventory control and the introduction of an inventory management system have helped us avoid wasting products. In my own kitchen, we implemented the Flambia System, which allows us to closely monitor inventory and order only what we really need.
6. Improper storage conditions
Improper storage conditions really can end in a major disaster. Preventing it avoids losses and waste. In my companies, we regularly control the temperature and storage conditions, which significantly extends the life of products.
7. Excessive or frequent orders
Orders that are too large and too frequent increase logistics costs. The key is to find the golden mean. Here again, the Flambia System came to our aid, which allows us to plan purchases precisely, avoiding excess and frequent deliveries.
Production and Preparation
8. Failure to follow set portion sizes
Using accurate recipes helps control costs and reduce waste. In our kitchens, every recipe is accurately measured, which helps to maintain consistency and control costs.
9. Poor organisation of work in the kitchen
Poor work organisation in the kitchen is like trying to lead an orchestra without a conductor – chaos is guaranteed. By introducing clearly defined procedures and division of labour, we have been able to increase efficiency and minimise waste. Regular training and systematic organisation are the keys to success.
10. Overly elaborate menus
Focusing on a narrower range allows us to better manage stock and avoid waste. In my own kitchen, we limited the menu to the most popular items to optimise purchasing and reduce costs.
11. Sub-optimal use of seasonal ingredients
Seasonal products are cheaper and often of better quality. In my businesses, we regularly adapt our menus to seasonal ingredients, which helps to reduce costs and offer customers fresh, local produce.
Management and Administration
12. Lack of price negotiation with suppliers
Negotiating prices with suppliers is essential – it’s like bargaining in a bazaar. Applying the Pareto principle and negotiating the prices of the most important products will bring the greatest savings. In our case, negotiating meat prices saved us 15%!
13. Lack of effective reporting
Lack of effective reporting is like driving a car without a mileage meter – you don’t know how fast you’re going or how much fuel you have in the tank. Regular reporting and food cost control is key to keeping costs down. At Flambia System we use advanced analytical tools that allow us to monitor all relevant indicators on an ongoing basis.
14. Poor internal communication
Poor internal communication is, in effect, a deaf telephone – information is distorted and results are far from expected. Effective interdepartmental communication allows us to better manage resources and avoid mistakes. Regular meetings and clear communication procedures have helped us to significantly improve operational efficiency.
Over time, this method got into my blood and proved useful in many other areas, such as remembering things! By grouping topics into: family, training, production, marketing, legal – it’s easier for me to remember everything. I don’t have an endless list of things, just baskets that I check in my head.
I believe that together we can bring best practice to the foodservice industry and end the myths that dominate the industry. This article is an excerpt from a guide I wrote for the community of Culinary Entrepreneurs, a new generation of foodservice business owners who are using technology and best practices to deliver the best quality for their customers and professional fulfilment and financial security for themselves.
Follow me on my social media for more interesting content!
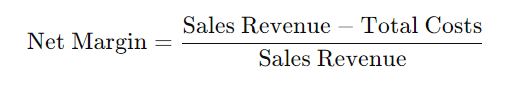
Catering profit comes in three layers. Gross margin is revenue minus the four variable costs — ingredients, packaging, labour, delivery. Operating margin then subtracts fixed costs like rent and core staff. Net margin is what survives after tax. Watch all three: a healthy gross margin can still end in a net loss if fixed costs are too heavy.
I have a confession to make. I love to eat. A lot. I eat so much that I had to set up a whole company to cook for me, because my wife couldn’t manage to produce the amount I consume. My standard is 3,500-4,000 kcal a day and my favourite place to eat is a restaurant. My lover has even come up with a trick to motivate me to be active. For me, activity has to have a purpose, so I love jujitsu, the gym (to get stronger at jujitsu), running (so I don’t run out of breath at jujitsu) and swimming (because it’s my time together with my daughter). If you say to me, “Let’s go for a walk to a café for dessert!” – I’m first.
The example for my breakfast. 🙂
The other thing I’m obsessed with is when things just work. An example would be the techniques in Jiu-Jitsu, which I’ve been training for 23 years, improving all the time and still finding ways to improve the small components. I can’t stand doing things in a sub-optimal order, like wandering around a shop without a written shopping list. But what frustrates me most is when things don’t work in business. When things don’t work, we have a loss-making business, an unprofitable business with negative margins.
Having run two meal prep (prepaid meal-plan) brands, one of which reached $203,956 in turnover per month at its peak, I have learnt that there is not one, not two, but even three catering margins!
Gross Margin, also known as Level I Margin
Operating Margin, also known as Level II Margin
Net Margin, also known as Level III Margin
Before we get into what these margins are, let’s get back to the basic question for which you are probably reading this article: “How do you run a profitable foodservice business?
A profitable business is one that makes a profit. If a business is not profitable, the problem is 100% one of two things, or worse, both at the same time:
The sales are too low.
Costs are too high.
If you ask, “Which is more important – revenue or cost?”, I will answer: “Revenue, but at what cost? Costs can be generated by any of us. Revenue, i.e. sales, requires some effort. We have to find a need in a group of people and then convince them to pay us to satisfy it with our product or service. I deliberately wrote “at what cost” because if increasing revenue is going to be done in an unprofitable way, we don’t want to do it.
“Thanks, Sherlock, I thought we were trying to sell at a price below our costs.” – Although this sentence sounds absurd and you’re right to think I’m stating the obvious, it’s not.
In winner-take-all businesses, managers sometimes make the decision to maximise revenue growth at the expense of profitability. Look at a major online marketplace that holds more than 60% of its home e-commerce market (yes, 6 out of 10 products sold online there go through it). Its annual profit runs to around $150 million. Despite many attempts, neither Amazon, eBay, Temu nor AliExpress managed to unseat it locally. From this point of view, would you be willing to accept a loss of $15 million per year for 5 years in order to grow your business to the point where it will generate $150 million per year as a near monopoly?
In the foodservice market we can find a similar strategy in meal prep. There are several well-known brands that communicate aggressive price discounts and may sell products with zero or even negative margins, e.g. with the intention of becoming the leader and causing the competition to withdraw. This is a fine line, as selling below cost to push rivals out is restricted in many markets.
Although, as I said earlier, revenue is ultimately more important, a profitable business starts with costs. We usually spend money first (costs) to get customers, and only then do they pay us (revenues). This is the first way your business can be unprofitable.
Gross Margin – Level I Margin
Gross Margin is the difference between turnover and the cost of goods sold. It tells you how much you are actually earning from the sale of your products after deducting direct production costs.
If your gross margin is high, it means that your production is going well and that you are able to sell your products at much higher prices than the cost of production. A high gross margin is a sign that your business is running efficiently and effectively.
The operating margin shows how much you earn from your core business after all operating expenses, but before tax and finance costs.
A high operating margin shows that you are managing your business well and controlling the costs associated with day-to-day operations. It’s a key indicator of how effectively you’re managing your day-to-day costs.
Net Margin – Level III Margin
Net margin is a ratio that shows how much you earn after deducting all costs, including operating, financial and tax expenses.
A high net margin is proof that your business is financially sound and can make a profit after all costs are taken into account. It is the ultimate indicator of the financial health of your business.
The importance of different margin levels
Gross Margin:
A high gross margin is a sign that your production is efficient and you can sell products at prices well above the cost of production.
Negative gross margin – “The cost of producing a good or service exceeds the amount you receive from sales”. How can this situation occur?
You sell a prepaid meal plan for days ahead at today’s prices. In the meantime, the cost of an employee, raw materials and transport increases. In a few dozen days, you realise that the amount of money you received from the customer at the beginning does not cover the cost of production.
You organise an event. It turns out that your equipment breaks down and your people get sick. You don’t have a choice because you’re bound by contract and you don’t want to lose face, so you hire equipment from a rental company and find people on the spot. Rental equipment is very expensive, and so are employees for the time being.
Operating margin
A high operating margin indicates that you are managing your day-to-day operating costs well, which is key to a healthy business.
Net Margin
A high net margin is an indication of the overall financial health of your business, showing that you are able to make a profit after all costs are taken into account.
This margin structure helps to understand and control the company’s finances, which is crucial for long-term success.
Based on my experience, I have identified 4 key elements that affect gross (stage I) margin in the foodservice industry.
Food cost – the cost of purchasing raw materials for production.
Labour – the time spent by employees cooking, packing and possibly delivering food to the table or home.
Logistics – in the case of home delivered food, this is the cost of an external or internal courier and their means of transport and associated costs.
Customer acquisition costs – marketplace commissions such as Uber Eats, DoorDash or Deliveroo, Facebook ad budget, ad agency fees, social media, photo production costs, graphics. All costs incurred to get the customer to buy from you.
Why gross margin matters?
The company that can spend the most on customer acquisition will always win. The company that can spend the most on customer acquisition is the one whose product prices are the highest, whose margins are the highest, and whose customers return most often and stay the longest. To put it in human terms, the ideal scenario is that you sell expensive products or services to customers, it costs you little to produce them compared to the amount you receive, and customers return to you regularly and for years.
Let’s suppose we have two restaurants, Green Pepper and Pink Orange:
Green Pepper attracts customers with discounts and attractive prices. Its owners rely on word of mouth and don’t have much money to spend on advertising, as they sell food with a minimal mark-up.
Cost of acquiring a customer – $8 – very low, as it’s mostly word of mouth.
Average bill – $25
Average cost – $20
Profit per customer visit – $5
Average number of visits per customer – 1.5 – the restaurant doesn’t even have a social media presence. Although the food is decent, customers just forget about it.
Total customer value – 1.5 * $5 = $7.50 – the amount Green Pepper can spend to acquire a customer and still end up with zero.
Pink Orange creates an exclusive brand where the cheapest water sells for $6, but the owners invest heavily in advertising and customers like the place and come back often.
Customer acquisition costs of $75 – they invest heavily in all possible customer acquisition channels.
Average bill – $125
Average cost – $20 – thanks to their size they can optimise costs and it is similar to Green Peppers.
Revenue per customer visit – $105
Average number of visits per customer – 5 – it is a trendy place, food is decent, customers are eager to return
Total value of the customer – 5 * $105 = $525 – the amount that Pink Orange can spend on acquiring a customer in order to come out at zero.
In this example, Pink Orange’s business is much more secure because of the margin it generates throughout the customer lifecycle.
How do you implement revenue counting, gross margin, operating margin and net margin?
The absolute most important thing, and the first thing you should do at this point, is to keep these numbers in front of you and your management at all times. You can’t control what you can’t see. It is not something you should “look at”. Your control cockpit should have 4 indicators that you control all the time. Monthly is the absolute minimum:
Revenue
Gross margin, also known as Level I margin
Operating margin, also known as Level II margin
Net margin, also known as Level III margin
If at this stage you are still thinking: “At my level, I don’t need to check it that way”, ask yourself whether you run a business or have an expensive hobby. If it’s the latter, you really don’t need to. I also refer you to 23 Biggest Myths About Catering Management.
The easiest way is to ask your accountant to give you a breakdown. Armed with this knowledge, you will be able to explain how she should qualify the costs. It’s not a perfect solution, as you’ll see the data with a delay of a month or more, but it’s better than not seeing the data at all.
The second method is to use a system that scans your invoices and helps you control your workflow, such as Cheff.it for restaurants or Flambia System for meal prep, diet catering, event catering, pre-school catering, hospital catering. Then you can react in real time.
Data is nothing without action. At my own brands we have a monthly meeting where we discuss important issues for the business, look at what has changed, why there have been increases and what has caused decreases. We come out of the meetings with a to-do list for which individual managers take responsibility. For example, I am responsible for customer acquisition costs, while my operations director is responsible for food costs and employee costs per package.
Just as data alone won’t make a difference, reading alone won’t make a difference. Take action now and increase your chances of making your foodservice operation profitable.
Take advantage of my free experience and sign up for my newsletter now. Follow me on my social media for more interesting material!
Food cost percentage is the net cost of a dish’s ingredients divided by its net selling price — never the gross, since VAT passes through. A $30 ingredient cost on a $100 net dish is 30%. Meal-prep operators should target roughly a quarter (about 25%) and check it every production run, not at quarter close.
“Stockholm syndrome” – only years later did I understand how the protagonist of Orwell’s 1984 felt. My tormentor was a maths teacher. She was no ordinary teacher, she was a crusading knight whose mission was to cleanse the world of the filth of those who did not know.
Only those worthy of respect and awe who could count without error were called to the blackboard. All others were treated with the contempt of second-class citizens. The pattern was always the same: first a friendly smile and a question as to who would come to the board to solve the problem on the board. No one came forward, so she continued with a beaming smile and said: “Then maybe one of you (whoever happened to be sitting nearest) will solve it”. If that student did not start writing immediately, the teacher’s forehead would start to sweat and she would start wiping it, which meant trouble.
The next sentence was: “Now write, Delta equals! What do you think?” If there was no surprise at this point, and it is usually difficult for her to follow under such pressure, the shouting began: “YOU CAN’T DO ANYTHING, SIT DOWN AND COMPLAIN!
I was a words-and-ideas kid and one of the worst in the class at maths. She despised me with all her heart. However, I decided not to be broken and practised maths every day. As a result, by the end of third grade I was really good, and although the teacher didn’t want to admit it, I was at the top of the class. She told me not to take the maths exam because I would make a fool of myself. To this day I have the satisfaction of thinking that when she found out about my maths score, she said it must be some kind of mistake – she was so unwilling to believe she was wrong. So if you hate maths, know that I really do understand. At the same time, I think it’s the most valuable skill in business, so I’m grateful for what I got at school.
Years later, in my professional work, I found that simple actions and the ability to measure things were very useful to me. Despite everything, I still thought that I was inferior in this area, that I couldn’t do anything. I graduated with a degree in psychology, where I felt inferior to the people from the business, economics and science programmes. I equated Excel with them. “It’s a tool for weirdos, what’s there to bury in numbers. Entrepreneurship is the spirit of adventure, ingenuity, action, not spreadsheets!”.
I was lucky enough to meet 3 wonderful people who helped me with the financial side of my ventures and taught me how to use counting in a practical way to give ingenuity a real dimension. The first was a seasoned CFO, the second a finance director who had scaled an operations-heavy business, and the third the finance lead who later joined my own company. From each of them I learned about cost control, budgeting, liquidity and profitability. Until recently, these words made me shudder, but I understood that I would not be a full-fledged entrepreneur without assimilating them – I accepted my fate. In the end, it wasn’t so bad.
Our CFO, right (in shirt), our head of operations, and our head of technology, left, in glasses.
I still only know how to do basic things like adding, multiplying, etc. My spreadsheets are ugly, but the most important thing is that I know how to read those made by people smarter than me, I know how to check basic business metrics and I know what to ask the people I work with. In the context of a food-prep operation, these two metrics are food cost and beverage cost. I’m going to tell you how I use these measures in practice in the meal-prep operation I ran across three of my own food brands.
In theory, the cost of raw materials consists of the following:
Purchase price of food.
Storage costs: costs associated with storing food, such as refrigeration costs.
Food waste: loss and waste due to expired products or inefficient stock management. This category also includes theft, which I have experienced on a number of occasions.
Labour costs: costs associated with food preparation, e.g. washing, peeling, cutting.
I say ‘theoretically’ because in practice it is difficult to separate the cost of energy for the fridge from the cost of energy for the oven, and losses and waste are difficult to measure without the right software and recorded inventory. We count energy costs as utilities, kitchen staff costs as cooking costs, and I will talk about counting food waste in the section explaining how to count it.
In addition, when we talk about food costs, we usually refer to their percentage value, i.e. the net purchase price of the raw material to the net selling price of the dish. This is a common mistake. Some people do not use the net value when counting, but one or two gross values. VAT is a pass-through tax and should not be tabulated.
For example:
I bought the meat for a steak for $30 net.
I sold the steak for $100 net.
Prepared meals in my market carry a reduced sales tax of 8%.
The customer paid $108 gross.
My food cost on the meal is 30% ($30 net / $100 net).
The same logic applies to drinks; the only difference is that drinks usually carry the standard, higher sales-tax rate rather than the reduced one.
The second type of food cost will be nominal. In the case of the steak above, it’s simply $30. What are the practical differences? The aim of you and the managers of your food operation – meal prep, prepaid meal plans, the diet-catering category we are building, hotel or restaurant – is to maximise customer satisfaction whilst minimising food and beverage costs, or at least not exceeding a certain assumed threshold. To put it in human terms, you want the customer to be as happy as possible, to recommend you to friends and to come back, and at the same time to pay as little as possible for food and drink.
What is the easiest way to reduce the food cost percentage? Increase the price of the food. If I increase the denominator, the selling price or the value I am dividing by, the result will immediately be lower.
For example:
I bought the meat for a steak for $30 net.
I sold the steak for $115 net.
The reduced sales tax on prepared meals is 8%.
The customer paid $124.20 gross.
My food cost on the meal is 26% ($30 net / $115 net).
As I’m sure you can see, this is not how it should work. This is where nominal food costs come in. Even if my steak sold for $108 and now sells for $124.20, the food cost is still $30, so it hasn’t improved.
Another common mistake is to include the cost of packaging. Packaging is a separate item and should be treated separately from the cost of raw materials. Firstly, some dishes will have different packaging and therefore different costs, and secondly, it is part of the logistics cost, not the production of the dish or drink.
Correctly counting and monitoring the price of food is a must for any foodservice business. I was surprised to find out how many thousands of dollars we were losing each month on peeling potatoes, for example. It turned out that, in the vast majority of cases, it was more profitable to buy a peeled pomegranate than to peel it ourselves, and the “one-off failure to observe the best before date” turned out, on closer inspection, to be no one-off. As I wrote in the article Optimising Food Costs: The Secrets of Effective Catering Management, this is one of the 4 key variable costs that determine whether your business will be profitable at gross margin level.
Food cost nominal vs. food cost percentage
Nominal food cost
Nominal food cost is the absolute amount of money spent on the purchase of raw materials used in the preparation of meals. It is a figure expressed in monetary units (e.g. dollars, euros, pounds). It is calculated as the sum of the costs of raw materials in a given period.
For example: If a kitchen spent $10,000 on food in a given month, the nominal cost of food is $10,000.
Meaning:
Food cost nominal shows how much money a restaurant actually spent on raw materials.
It makes it easier to track expenses and control the budget.
It is the basis for further financial analysis, such as comparison with turnover.
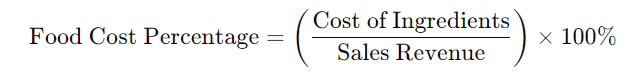
Food cost percentage
Food Cost Percentage is an indicator that shows what percentage of food sales revenue is spent on food costs. It is expressed as a percentage and is calculated as the ratio of raw material costs to sales revenue in a given period.
Formula:
Food cost percentage formula.
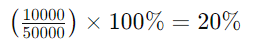
For example: If a kitchen spent $10,000 on raw materials and took $50,000 in sales, the food cost percentage is:
Meaning:
Food cost percentage allows to evaluate the effectiveness of raw material cost management in relation to sales.
It makes it possible to compare profitability over different periods or with other restaurants.
It is an indicator that helps to determine whether raw material costs are under control.
Summary
Food cost nominal tells us the total amount spent on raw materials, which is important for managing the budget and tracking expenses.
Food cost percentage shows what percentage of sales is spent on food costs, allowing you to assess the operational efficiency and profitability of your restaurant.
Monitoring both metrics is key to effective cost management in the foodservice industry, allowing you to control expenses and evaluate efficiency in relation to revenue generated.
The second dimension is food and beverage costs, both direct and indirect.
Differences between direct and indirect costing
Both methods have their own unique characteristics, advantages and disadvantages. Here is a detailed discussion of the differences between the two:
Direct calculation
Description: Direct costing involves directly counting the cost of raw materials used to prepare meals in a given period. This method accurately records the quantities and costs of raw materials used to prepare each meal.
Process:
Purchasing: Recording of all raw materials purchased.
Consumption: Monitoring the consumption of each raw material based on recipes and prepared dishes.
Calculation: Add up the cost of raw materials used to get the nominal cost of food.
Advantages:
Precision: Allows you to accurately track the costs associated with each dish.
Control: Allows detailed control of raw material costs and identification of areas for optimisation.
Disadvantages:
Time consuming: Requires accurate tracking of all raw materials used, which can be labour intensive.
Complexity: Can be difficult to implement in restaurants with a wide variety of dishes and raw materials.
Intermediate calculation
Description: Indirect costing calculates the cost of raw materials consumed during a given period by taking into account the changes in inventory at the beginning and end of the period. This method is more general and less detailed than direct costing.
Process:
Initial inventory: Record the value of the stock at the beginning of the period.
Purchases: Record any raw materials purchased during the period.
Closing Inventory: Record the value of stock at the end of the period.
Calculation: The cost of food is calculated as the difference between the sum of opening stocks and purchases and closing stocks.
Calculation:
Intermediate calculation formula
Advantages:
Simplicity: It is easier to implement and less time consuming than direct calculation.
Efficiency: A quick method to get an overall picture of raw material costs in a short period of time.
Disadvantages:
Less accurate: It does not provide detailed information on the cost of individual dishes.
Difficult to identify problems: Less accurate cost tracking can make it difficult to identify areas for improvement.
Conclusion
Direct calculation is more accurate, but time consuming and complicated. Ideal for restaurants that require detailed cost tracking and have the resources to accurately monitor raw material consumption.
Indirect calculation is simpler and quicker, but less accurate. It works well for restaurants that need a quick assessment of total raw material costs and have fewer resources for accurate monitoring.
We use both in our business. Direct costing is essential for menu planning. We use it once a week to plan the dishes that will appear on our menus. Normally this would be time consuming, so having the recipes written down is crucial.
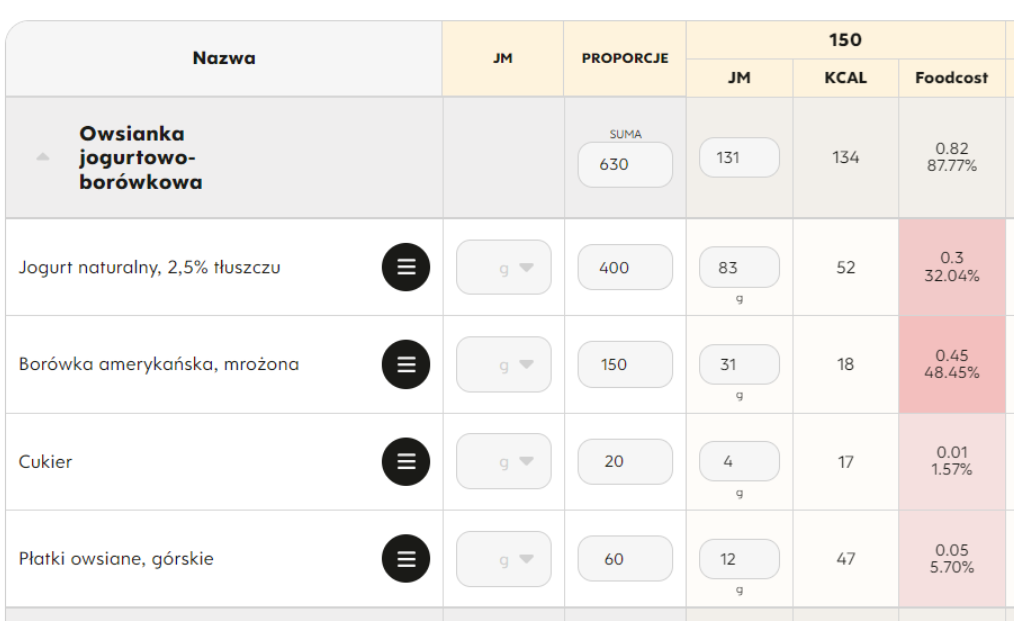
In the basic version you can do it in Excel and update the prices manually every week, but we use Flambia System and Flambia Market. The former works out the total cost of a dish for us and also shows which ingredients contribute the most to it – both as a percentage and by highlighting them with darker colours. This is a huge help to the person controlling the food cost of dishes and making changes to dishes, as it is often enough to minimally reduce the content of the ingredient with the highest food cost in a dish to significantly reduce the value of that ingredient.
Changing the content of an ingredient that has little impact on the food cost will have almost no impact and will be a waste of time. In the example below, you can see that the ingredient to focus on to reduce the food cost of the dish will be blueberries, as they account for almost 50% of the total cost of the dish at this point.
A screenshot of the Flambia System.
The Flambii system also gives you the ability to create different price groups for dishes and control their allocation, depending on pre-set price limits for the cost of the dish. If the cost of a dish exceeds the limit set for it (either upwards or downwards), the system will inform us in an easily recognisable graphical way, both in the Menu Planner, if the dish has already been added to it, and in the list of all the dishes in the “Dishes” tab, which is used when selecting dishes for the menu. This reduces the risk of overlooking a change in the cost of a dish and incurring losses as a result. In the list of dishes there is also information about the percentage of the food in relation to the established norm.
Screenshot of the Flambia System.
The Flambia Market shows where an ingredient is cheapest and provides information on the current prices for recipes.
On average, a human and a dog have 3 legs each. Therefore, the ‘average’ food cost should be approached very carefully. You need to find the right level of detail. Looking at the big picture will not tell you much. Let me give you an example. I used to track costs averaged over all diets and calories separately. I saw that for the group as a whole they seemed to be in line, but there was little money left over. Looking for the reason, I looked at each calorie separately. It was a hit! It turned out that we were selling the lowest calorie of some of the diets below the cost of production, we were subsidising up to $1 per pack! If that doesn’t seem like a lot, multiply it by hundreds of packs – a day, thousands – a month, tens of thousands – a year. The hardest part was recognising the problem because of the wrong way of looking at the numbers. Once we diagnosed the problem, the solution was quick and easy.
Don’t be fooled by “we can’t reduce food costs without reducing quality”. – This is one of the most common myths. Read more about it in 23 Biggest Myths About Catering Management. This and other untruths are repeated because it takes extra effort to change, to find the reasons. It is easier to use two “proven” suppliers than to compare prices from 20 or 30 different suppliers. I say this without sarcasm. With the amount of hours you work in catering, it is really difficult. We had this problem ourselves, which is why we created Flambia Market, to finally have shopping under control.
If, like us, you believe in smart and informed purchasing for the catering industry and are a pioneer of modern solutions that bring savings and improve the quality of our services, then join us.
Together we create a community that supports each other and strives for excellence in every aspect of our work. Take the first step and sign up for the newsletter. Also follow me on my social media for more interesting content!